
Great news for Google Analytics users who can now track their website’s traffic statistics on real time basis. Google has first time introduced the new real-time widgets that can be plugged into existing Google-Analytics Dashboard. It will certainly help users to perform many types of real-time analysis that too at a glance. Real time widgets can help to monitor visitor activity as it happens on the website.
Now the widgets can very easily be combined and customized with different filters in order to segment and compare data side by side. Then the user can very well compare the real-time and non-real-time widgets that too on the same dashboard.
Let us go through the following steps in detail to understand how to use these widgets:
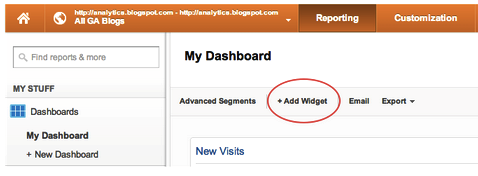
In order to set up the real-time widget, users are required to click on the +Add Widget menu option on the Google-Analytics dashboard.
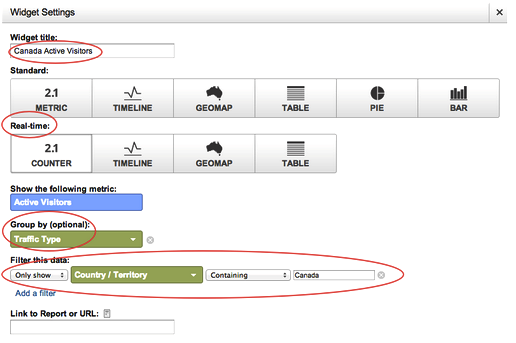
If widget has been added, then from the Real-time section users can select Counter, Timeline, Geomap or Table. The widget’s settings and filters can be customized in order to pull out the most relevant data to user.
The moment widget has been saved, users can very easily access real-time data at that very instant from their Google Analytics dashboards. With the creation of proper combination of widgets, many types of analysis can be done.
Also, the use of filters can actually help to compare different segments of real-time website traffic. For example, two separate widgets can be created that have filters for Country dimension (say Country==US for one and Country==Canada for another) and you can compare real-time USA traffic versus other country traffic, side by side.
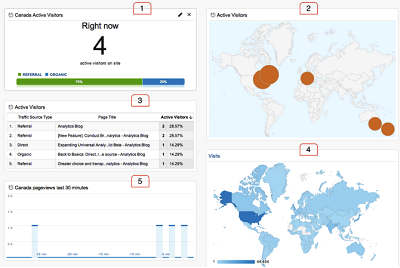
Hence with the introduction of these real-time widgets on Google Analytics now users can immediately and continuously monitor the effects that new campaigns and site changes have on traffic.
For further details please click here: Analytics Blog


Tell us your thoughts in the comments