
Image Source: Developers.Google.com
Why Is It Important for a Brand to Track Site Traffic?
For a brand to succeed in a landscape riddled with competitors, knowing their audience and what they want is a must. The best way to do this is through traffic statistics, and this is exactly what web analytics tools provide.
Web analytics can help any brand, be it big or small, known or unknown, understand their popularity and how their audience behaves on their site. With this data, brands can tailor a marketing strategy geared toward their audience, allowing them to achieve their business objectives.
What Tools Can You Use to Monitor Site Traffic?
There are many web analytics tools available to monitor site traffic. Some examples are Google Analytics, Webtrends, IBM Unica and more.
If you’re wondering what you can track with these tools, here it is:
- Number of site visitors, both new and returning
- Sources and mediums of your site’s traffic
- Geolocations of your visitors
- Your user’s behavior
- Your site’s conversions and leads
- Your user’s journey within your site
- Devices used (desktop vs. mobile) by your site’s visitors
Google Analytics is by far the most popular analytic tool on the market. As such, we’re going to discuss how a brand or webmaster can easily view and monitor site traffic and visitor behavior with it. Feel free to scroll to the glossary at the end if you come across a term you’re not familiar with.
Google Analytics
Let’s start with some background information. Google Analytics is a cloud-based analytics tool used to measure and report website traffic, user behaviors, geolocations, conversions and much more (think of it like the Swiss Army knife of website analytics). As we covered earlier, it’s the most widely used web analytics tool on the Internet. If your website’s configured on a Google Analytics account, you can easily track its status by using a login ID and password. As a webmaster, you can access the Google Analytics tool here.
Let’s dive deeper. The Google Analytics reports are categorized into 4 parts:
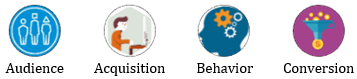
- Audience Report: The audience report provides insight into the characteristics of your website’s users. Here, you can find details of their demographics, geolocations, behaviors, technology, devices and more.
- Acquisition Report: The acquisition report provides insights regarding your website’s traffic sources such as search, direct, referral, email, social, paid and more.
- Behaviors Report: The behavior overview report reveals what pages your visitors are viewing, time spent, pagespeed and what actions they’ve taken.
- Conversion Report: The conversion report provides information related to conversions. Under this section, you can configure your goals or conversion types for tracking.
Now that you have a good idea of what Google Analytics entails, it’s time to understand how to access it so that you can monitor site traffic, user behavior, and view reports. Here’s an easy step-by-step guide for your convenience:
Step 1: After Login, Select the Appropriate Site to Receive Site Analytics Data
Once you log into your Google Analytics account, you’ll land on the homepage. From here, you’ll need to select the right site property to access the desired traffic analytics. Check out the snapshot below for a better picture:
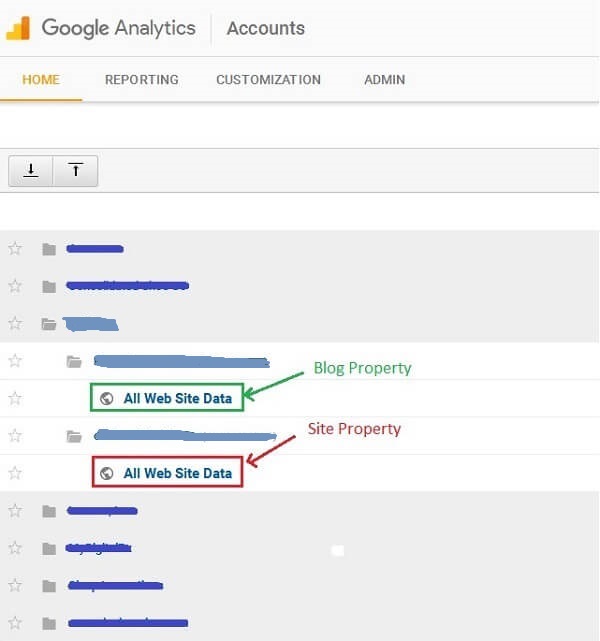
Once you click on the desired property, you’ll be taken to the “Reporting Dashboard,” which you’ll use to access the desired analytics data.
Step 2: Understanding the Reporting Dashboard Interface
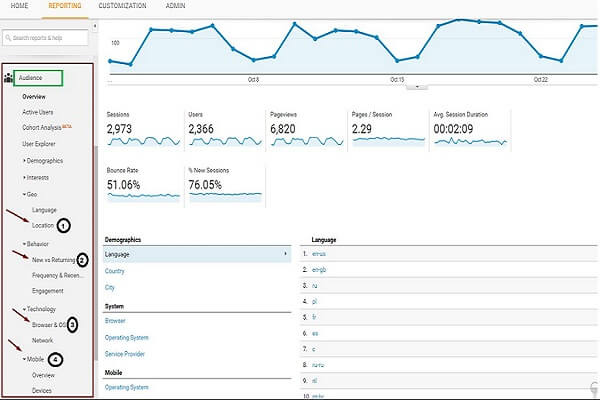
Once you select the desired site, you’ll land on the reporting dashboard, as seen in the snapshot below:
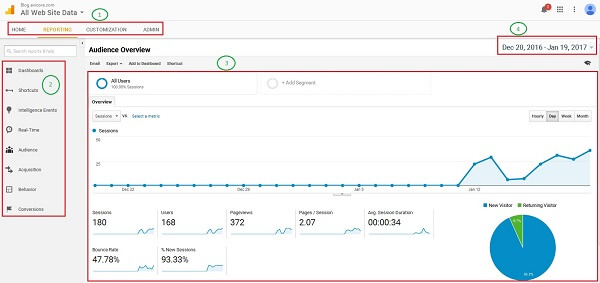
- Main Navigation: The main navigation features are: home, reporting, customization and admin. These allow you to navigate through the different sections of your Google Analytics account.
- Reporting Dashboard: The reporting dashboard is a collection of widgets that give you an overview of the reports and metrics you care most about as a brand. The dashboard lets you monitor many metrics at once, so you can quickly check your accounts’ traffic and health, or find correlations between different reports.
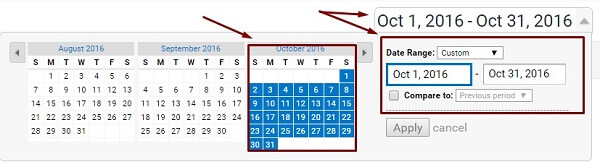
- Time-Period (Date Range): The date range selector is at the top right of every page. By default, Google Analytics will show data for the past 30 days. To select an alternate date range, click the arrow next to the existing date range to open the selector. Once you’ve selected a new date range, click “apply” to update your report.
- Main View: The main view is where the reports and data are presented. This section will provide a detailed overview of your audience.
Step 3: An Overview of the Key Categories of Your Google Analytics Report
The Google Analytics report is categorized into four parts. These are the key areas of Google analytics reporting that you should focus on, so pay close attention and don’t skim!
1: Audience
First up is your audience. The audience report gives you a quick overview of your website’s overall performance, including number of sessions, users (both new and returning), pageviews, average session duration, bounce rate, user locations, device information, and the operating system used by your users.
Want more information? No problem, here it is:
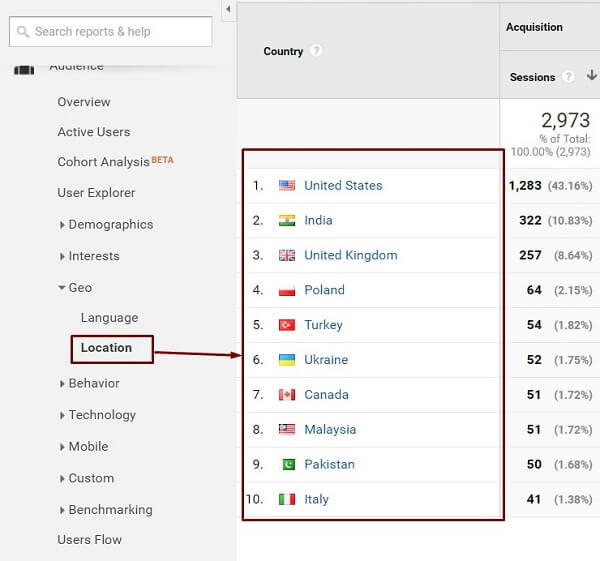
- User Location: The location report provides information about your user’s geographic location (i.e. country).
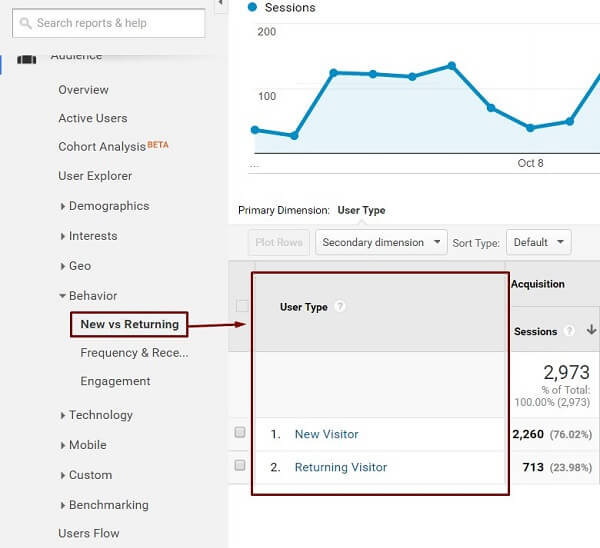
- New and Returning Visitors: This report provides information about the total number of visitors your website receives, and breaks it down further into new vs. returning visitors (quite convenient!).
- Browser and Operating System: This report provides information about what browsers and operating systems your site’s visitors have used.
- Mobile Overview: This report provides information regarding the device people have used to access your site (desktop vs. mobile vs. tablet).
2: Acquisition Overview
Up next is an overview of your website’s the top channels generating traffic. These include direct traffic, organic search, referral, social media, display advertising, email and paid search (i.e. AdWords).
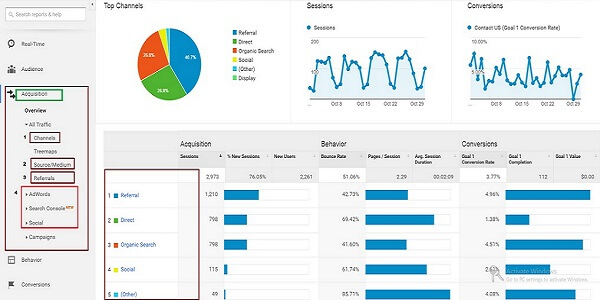
- Channels: This section provides information regarding the different traffic mediums such as organic, referral, paid, social and others.
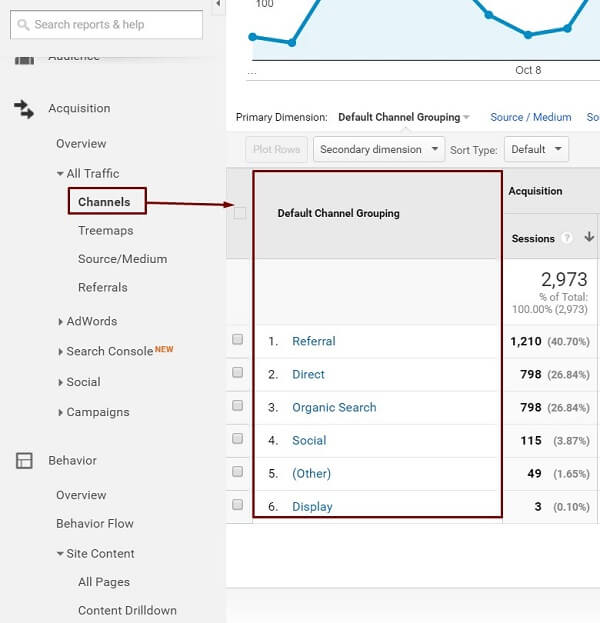
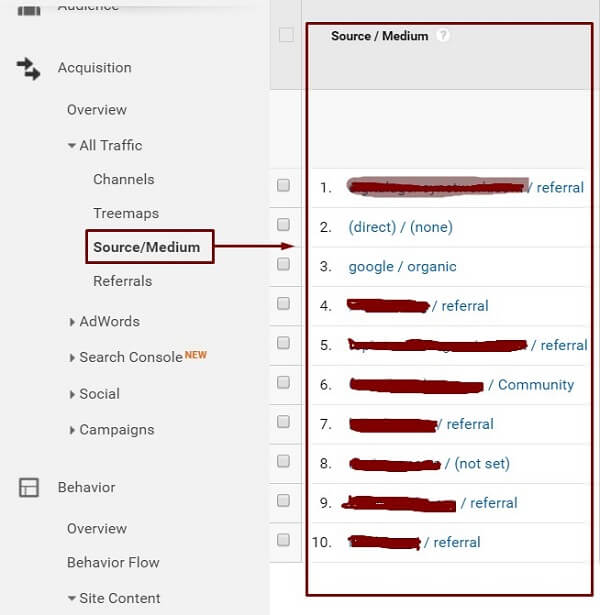
- Source/Medium: This section provides information about the source/origin of your traffic. A source may be a search engine (Google) or a domain (aumcore.com). It also provides information regarding the medium (general category) of the source. For example, the medium could be organic search, cost-per-click paid search (CPC), or web referral.
- Referrals: The referrals report provides information about the segment of your web traffic that arrives through another source, such as a link on another website.
- AdWords, SEO and Social: This report provides information about your current and past AdWords campaigns, the performance of your website on search engine results (SEO), and traffic from social media websites. As a quick heads up, to get to the SEO data, Google Analytics should be integrated with Google Search Console. While this report is extremely helpful, for better results get in touch with your friendly neighborhood SEO agency.
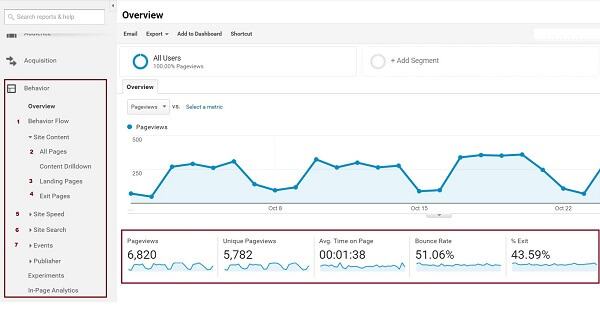
3: Behavior Overview
What good are analytics if you can’t track behavior (still good, but that’s not the point)? Fortunately, that’s not a concern you’ll have because it just so happens to be that the behavior overview report reveals what pages people visit on your website and what actions they take while visiting. It also provides information about user behavior flow, pageviews, bounce and exit rates, pagespeed insight, site search and events.
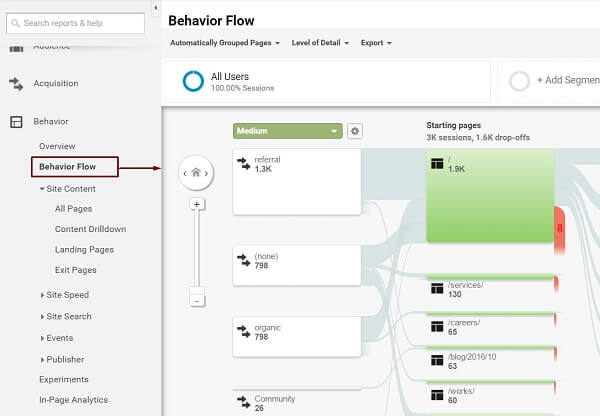
- Behavior Flow: The behavior flow report visualizes the path user’s travel as they go from one page or event to the next. This report can help you discover what content keeps users engaged within your site, and also identify potential issues with content.
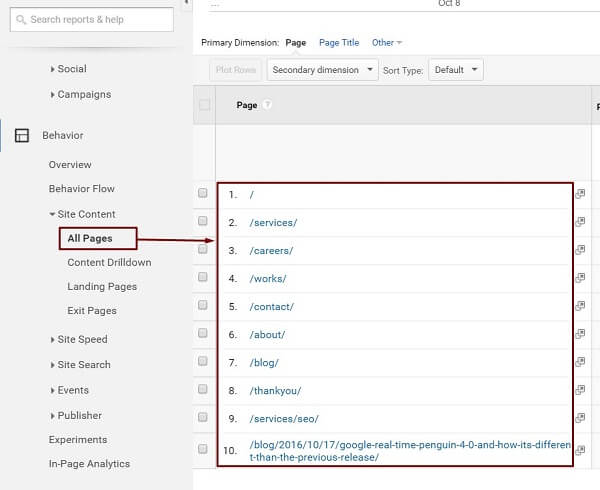
- Site content: All Pages: This report provides information about what the most visited webpages of your website are.
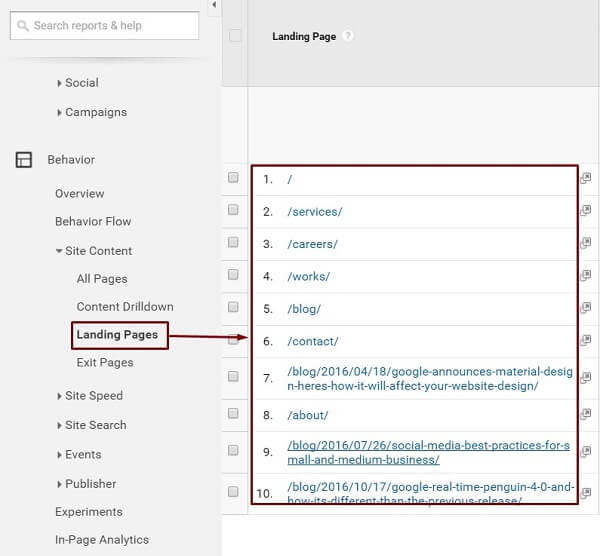
- Landing Pages: The landing page report provides information about the first page people visit when they land on your site.
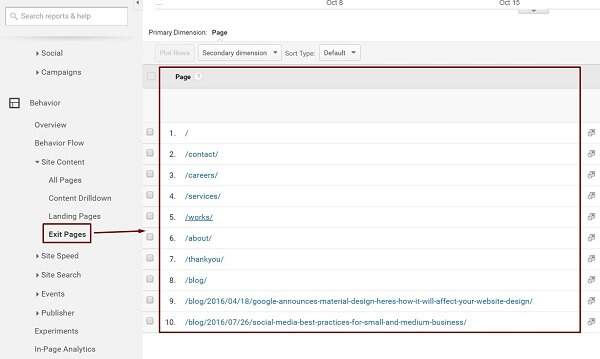
- Exit Pages: The exit page report provides information about the last page people visit before they leave your site.
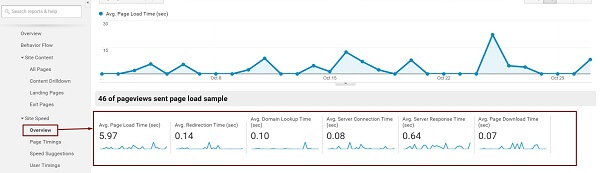
- Site Speed: The site speed report provides information about the time it takes for your site’s pages to load. It also provides suggestions you can make use of to improve the your pages’ average load time.
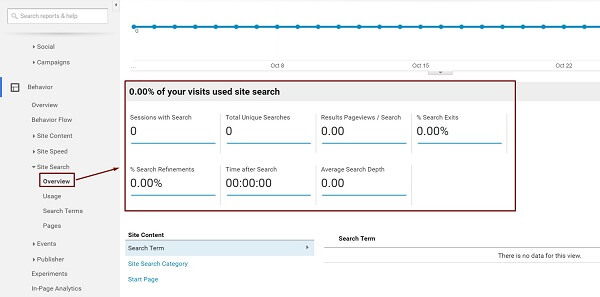
- Site Search: The site search report provides information about the search queries that visitors use to find products within your site. Keep in mind that you’ll need to enable site search functions to make use of it.
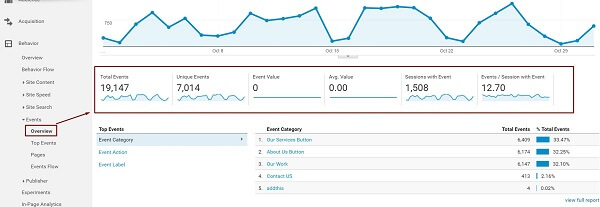
- Events: Events are user interactions with your site’s content. Events provide information regarding your visitors’ activities such as downloads, mobile ad clicks, gadgets, Flash elements, AJAX embedded elements, and video plays.
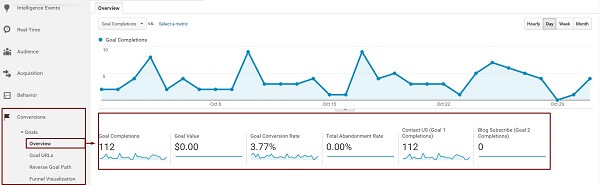
4: Conversions
You can’t forget conversions. These include form filling, product sales, or any other activity that achieves a business objective. For monitoring purposes, the conversion goal overview report reveals the status and completion of goals.
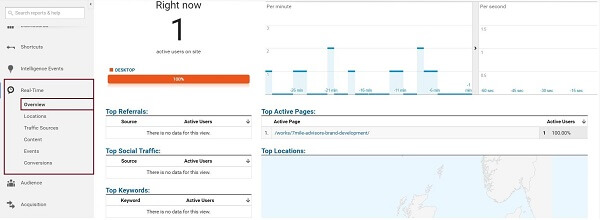
5: Real Time Reports
Last but definitely not least, the real time report allows you to monitor activity as it happens on your website. This can be how many people are on your site right now, what pages or events they’re interacting with, or what goal conversions have occurred.
Step 4: How to Generate a Report in Google Analytics
Rounding off the steps we’ll cover today is generating a report with Google Analytics. Reporting is a major part of any analytics account, and under Google Analytics it’s very easy to generate a report based on any selected metric. Below are the required steps to export a report:
- Plan the type of report you want to create. For example, if you want to create a report based on the “direct traffic” you received on a particular day:
- Go to the calendar and select a desired date in order to fetch the direct traffic data.
- Go to the left hand side to find the link for direct traffic.
- The flow to find direct traffic is as follows: Go to Acquisition > All Traffic >> Channels >> Direct
- Check out the snapshot below for a visual example:
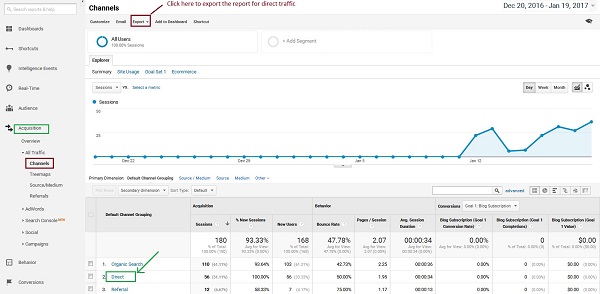
- Click “export” (below the report title)
- Select one of the export formats:
- CSV
- TSV
- TSV for Excel
- Excel (XLSX)
- Google Sheets
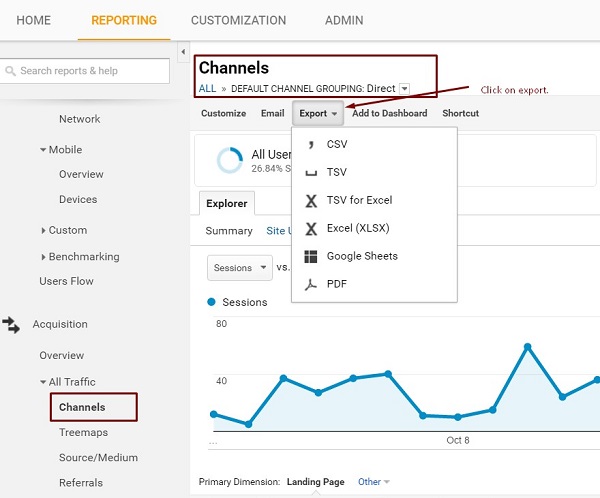
Your file will generate automatically and will be available in the download directory on your computer. You can use this method to easily download any Google Analytics metric report.
Concluding Words
Put down whatever “Understanding Google Analytics for beginners” book you have because you should now know how to interpret Google Analytics data like a pro. Better yet, if you’re using a digital asset management software, you can use Google Analytics as a complement to review statistics. As a final note, the Google Analytics report you see above is how it looks like when you export it with the settings we covered (the snapshots used are just for informational purposes), so make sure to apply whatever date range and report settings you need when exporting your own.
Glossary of Terms
- Dashboard: This is a customizable area for everything you need in Google Analytics. It’s the first thing you see when you log in and includes many ways of displaying your data.
- Bounce rate: Percentage of users who visit a page on your website and leave.
- Conversion: This is when a user does something that you want them to do such as purchasing a product, completing a contact form, etc.
- Custom reporting: Google Analytics has the option to create custom reports based on the metrics and dimensions you’ve selected. Custom reports present the information you have selected in a way that works for you.
- Exit page: The last page a user views on your website.
- Filters: A means of controlling or changing the data that appears.
- Goal: Goals can be set up in Google Analytics to track conversions. They relate to a quantifiable action that your website visitors can take that you deem a success. For example, buying a product, signing up to your newsletter, or downloading a PDF are all goals.
- Goal conversion rate: This is the percentage of visits on a site during which the user completes one of your goals (e.g. buying a product).
- Events: Events are user interactions with content that can be tracked independently from a web page or a screen load. Downloads, mobile ad clicks, gadgets, Flash elements, AJAX embedded elements, and video plays are all examples of actions you might want to track as Events
- Keywords: These are the words that lead users to your website when using a search engine. Google Analytics provides a list of these words, allowing you to know how your users have found you.
- Landing page: This is the page that users first see during their session, also known as an entrance page.
- Percentage of new sessions: The percentage of overall users that were first time users to your site.
- Organic traffic: Users who have come to your website from organic search engine results, not via paid ads.
- Page views: How many times a web page has been clicked on and loaded.
- Session/traffic: A session is when a user visits a website and spends time browsing through pages and then leaves.
- Unique visitor: This term refers to a user who visits your website more than once within a specific time period (e.g. a month).
- Average session duration: The average time users spend on a page. Google Analytics measures this by calculating the time between one page being viewed and clicking on another page on your website. This means that if someone spends 20 minutes thoroughly reading a blog post and then leaves the site from that page, Google Analytics will not record that time.